ApacheBenchのスコア
WordPressの表示速度(性能)を測るのにApacheBenchを用いられることが多いので、うちのサイトでも試しに測定してみました。
ただし、うちのサイトの場合はCloudFlareを軽油してパケットが送られてくるので(名前解決でCloudFlareのIPアドレスを返してくるため)、/etc/hostsファイルにIPアドレスとホスト名を書いて、直接ローカルホストで測定できるようにしました。
$ ab -n 100 -c 100 https://206rc.net/
This is ApacheBench, Version 2.3 <$Revision: 655654 $>
Copyright 1996 Adam Twiss, Zeus Technology Ltd, http://www.zeustech.net/
Licensed to The Apache Software Foundation, http://www.apache.org/

Benchmarking 206rc.net (be patient).....done


Server Software:        nginx/1.8.1
Server Hostname:        206rc.net
Server Port:            443
SSL/TLS Protocol:       TLSv1/SSLv3,ECDHE-RSA-AES256-GCM-SHA384,2048,256

Document Path:          /
Document Length:        64030 bytes

Concurrency Level:      100
Time taken for tests:   0.497 seconds
Complete requests:      100
Failed requests:        0
Write errors:           0
Total transferred:      6443900 bytes
HTML transferred:       6403000 bytes
Requests per second:    201.27 [#/sec] (mean)
Time per request:       496.846 [ms] (mean)
Time per request:       4.968 [ms] (mean, across all concurrent requests)
Transfer rate:          12665.64 [Kbytes/sec] received

Connection Times (ms)
              min  mean[+/-sd] median   max
Connect:        7  332  35.8    335     360
Processing:    32   95  15.6     96     119
Waiting:        4   93  17.0     95     118
Total:         39  427  48.4    431     479

Percentage of the requests served within a certain time (ms)
  50%    431
  66%    447
  75%    455
  80%    461
  90%    471
  95%    475
  98%    478
  99%    479
 100%    479 (longest request)
Requests per second は 201.27 [#/sec] とまあまあの性能ですね。
何度か試してみましたが、190前後はコンスタントに出ます。
上を見ればキリがありませんが、一日のPVが300未満のサイトにしては十分すぎるでしょう(笑)
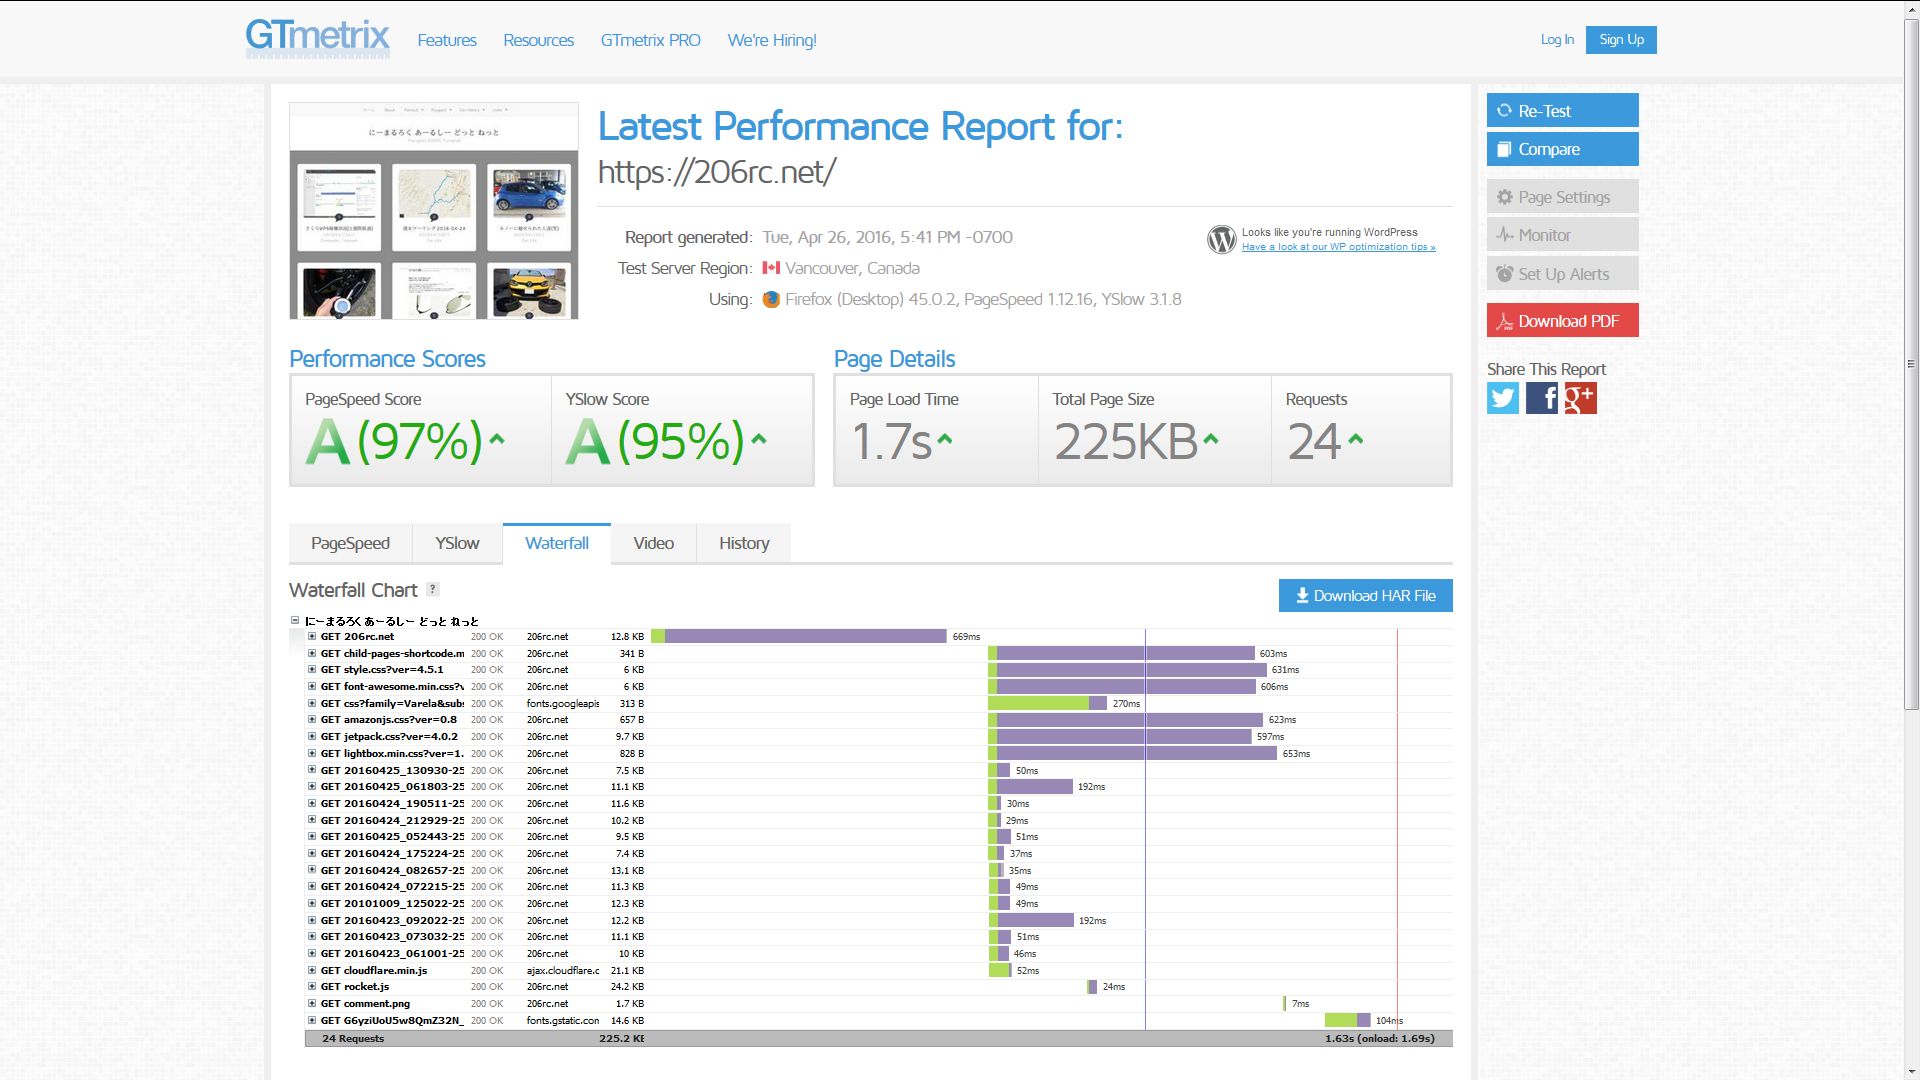
GTmetrixのスコアは大きな変化はなし。
スコアの高さとアクセス数は比例せず(笑)、Webサイトで大事なのはコンテンツ(中身)の質なのだ。
$ ab -n 100 -c 100 https://ik1-301-10676.vs.sakura.ne.jp/
This is ApacheBench, Version 2.3 <$Revision: 655654 $>
Copyright 1996 Adam Twiss, Zeus Technology Ltd, http://www.zeustech.net/
Licensed to The Apache Software Foundation, http://www.apache.org/

Benchmarking ik1-301-10676.vs.sakura.ne.jp (be patient).....done


Server Software:        nginx/1.8.1
Server Hostname:        ik1-301-10676.vs.sakura.ne.jp
Server Port:            443
SSL/TLS Protocol:       TLSv1/SSLv3,ECDHE-RSA-AES256-GCM-SHA384,2048,256

Document Path:          /
Document Length:        25653 bytes

Concurrency Level:      100
Time taken for tests:   4.936 seconds
Complete requests:      100
Failed requests:        0
Write errors:           0
Total transferred:      2590400 bytes
HTML transferred:       2565300 bytes
Requests per second:    20.26 [#/sec] (mean)
Time per request:       4935.952 [ms] (mean)
Time per request:       49.360 [ms] (mean, across all concurrent requests)
Transfer rate:          512.50 [Kbytes/sec] received

Connection Times (ms)
              min  mean[+/-sd] median   max
Connect:       10  335  37.5    340     369
Processing:    58 2249 1321.9   2292    4508
Waiting:       56 2247 1322.3   2291    4506
Total:         97 2584 1324.6   2610    4858

Percentage of the requests served within a certain time (ms)
  50%   2610
  66%   3332
  75%   3736
  80%   3967
  90%   4441
  95%   4666
  98%   4805
  99%   4858
 100%   4858 (longest request)
比較対象として同じサーバに素でインストールしたWordPressの測定結果を載せておきます。
コマンドを叩いた瞬間に違いがわかります....レ、レスポンスが遅い(笑)
基盤となるnginx、PHP、MySQLは共通なので、WordPressのチューニングだけで約10倍の差が出るということですねぇ。